The Data Collection and Evaluation module responds to the needs of production plants, which need to continuously control the quality of production on their production lines. The module offers a set of functionalities supporting basic processes:
- production data collection
- evaluation of production data against the assumed parameters of the characters
- use of SPC methodology for data analysis, calculation of process capability
All recorded data are immediately stored centrally, evaluated and, if necessary, the relevant responsible persons are notified. Thanks to this, possible non-compliance with production quality standards can be detected early.
Main module functionalities
- Continuous and automated evaluation of data from machines on lines
- Evaluation by SPC methodology (X-R analysis, X-s analysis, Me-R analysis)
- Adjustable notifications in case of non-standard data
- User definition of monitored quantities
Module conception
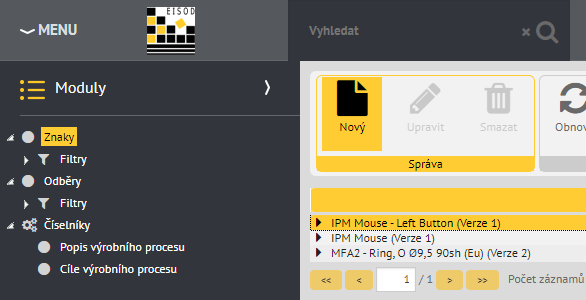
Product and characteristics
In order to be able to enter subscriptions evaluated by the SPC method, it is necessary to have created product version characteristics. The product with the characteristics can be created from the “Product Catalog” support module.
Data collection from the Data collection and evaluation module
The creation of subscriptions can be achieved in three ways:
- By selecting “New sample” after selecting the characteristic (s) of the same product with the same number of samples
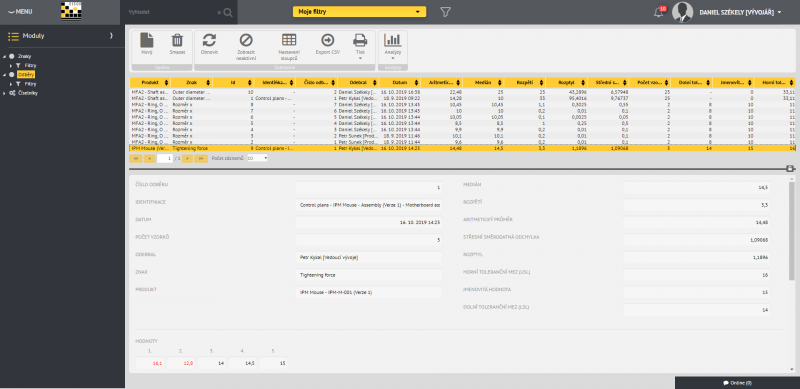
- Select “New” from the collected data view
- By creating a new control record from the Control Plans module
Collected data can be displayed in a sortable and filterable list. After selecting the sampling, its detail will be displayed, including the display of the sampled values plotted in the context of tolerance limits and nominal values.
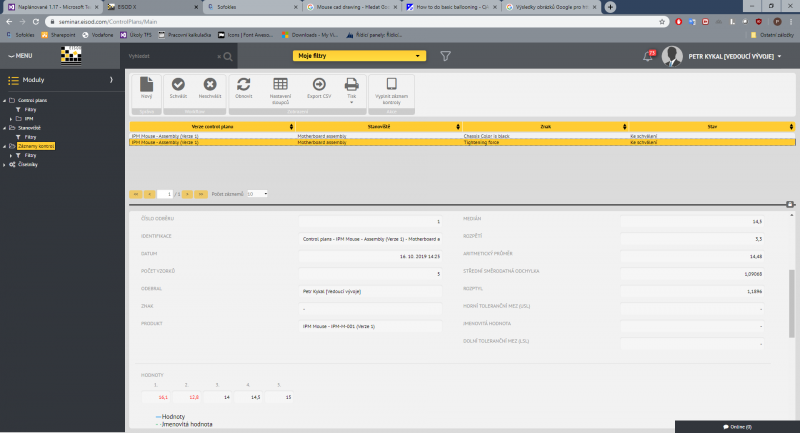
Data collection from the Control Plans module
By updating the control plan, it is possible to start collecting and evaluating production data on the affected production lines. The inspection is differentiated according to the role of the responsible employee, location, frequency and scope of the inspection. The overview of control records can be filtered according to all recorded data and metadata, and individual filters can be saved for re-use. In the case of 100% machine checks, EISOD can be linked to data from lines as part of the implementation and this data can be evaluated online. In the case of checks performed by the operator, the EISOD system can be configured with support for reading data in the form of QR code directly from the production lines by the operator’s tablet. With one click, the operator receives an exact schedule of checks to be performed. Checks can be visual or numerical. Depending on the setting of a specific characteristic, the data collection of a numeric characteristic can be evaluated in accordance with the SPC methodology. The required records are validated immediately after completion and in case the value does not correspond to the required range, the responsible persons are notified. The inspection record is subject to a simple approval workflow so that it can be documented if the deviation has been accepted or not.
Data analysis and evaluation
In the Data collection and evaluation module, advanced analyzes for eligibility can be performed over a filterable set of samples.
The module supports the following analyzes:
- X-R analysis (diameter and span diagrams)
- X-s analysis (mean and standard deviation diagrams)
- Me-R analysis (diagrams for median and range)
Analyzed data records can be created directly from the Data Collection and Evaluation module or can come from a control record from the Control Plans module.
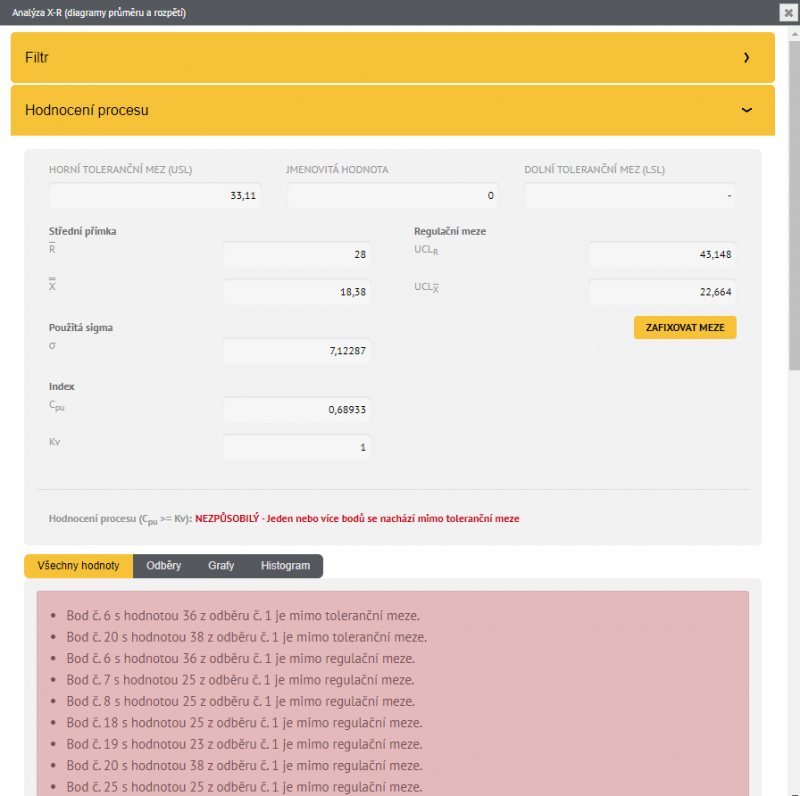
Process evaluation
The aim of the analyzes is to determine the process capability according to the SPC methodology. The module calculates all the necessary values to determine the process capability and compares the calculated capability with the required one. If one or more points exceed the tolerance limits, the process is automatically evaluated as incapable.
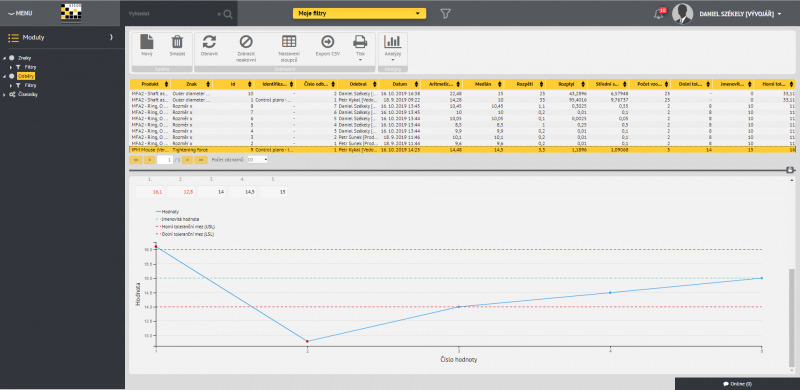
Graph of all evaluated values
Analyzes always contain a graph of all evaluated values in the context of calculated control limits, tolerance limits, average and nominal value. Values exceeding the tolerance limits, exceeding the control limits or not meeting one of the rules are visibly marked.
The analyzes follow and check the following rules:
- One of the points lies outside the tolerance limits
- One of the points lies outside the control limits
- Seven or more consecutive points are on one side of the average value
- Seven or more consecutive points have an increasing or decreasing tendency
- Seven or more consecutive points are in close proximity to the average value
- Seven or more consecutive points are in close proximity to the control limits
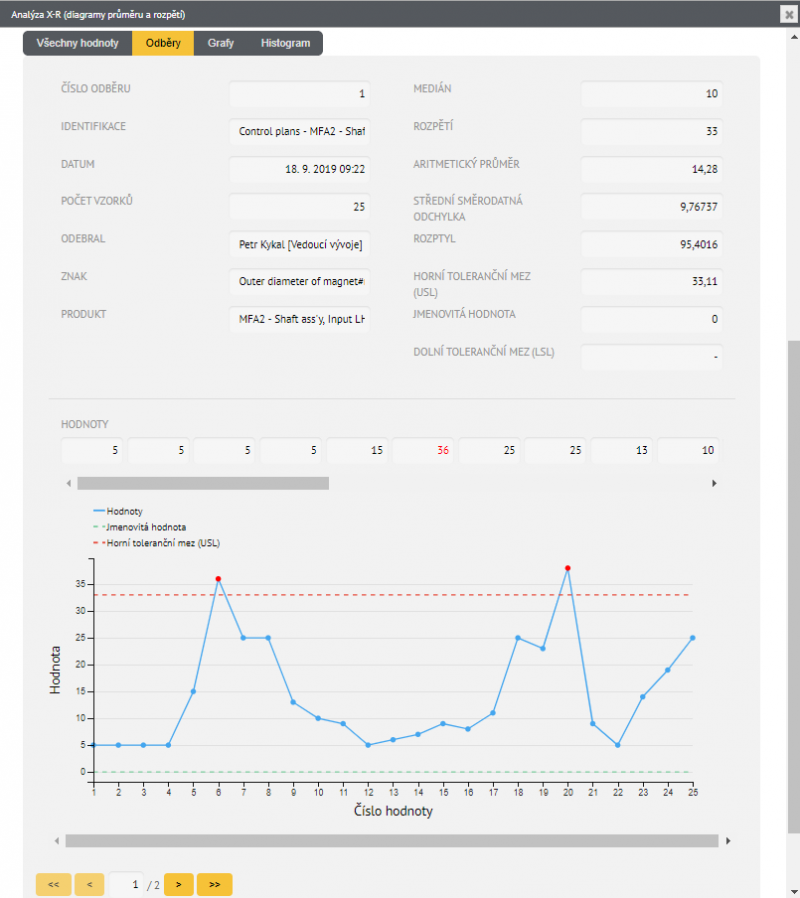
View of individual collected data
- All analyzes allow the display of individual samples, all their parameters and the sample value plotted on the graph in the context of tolerance limits and nominal values.
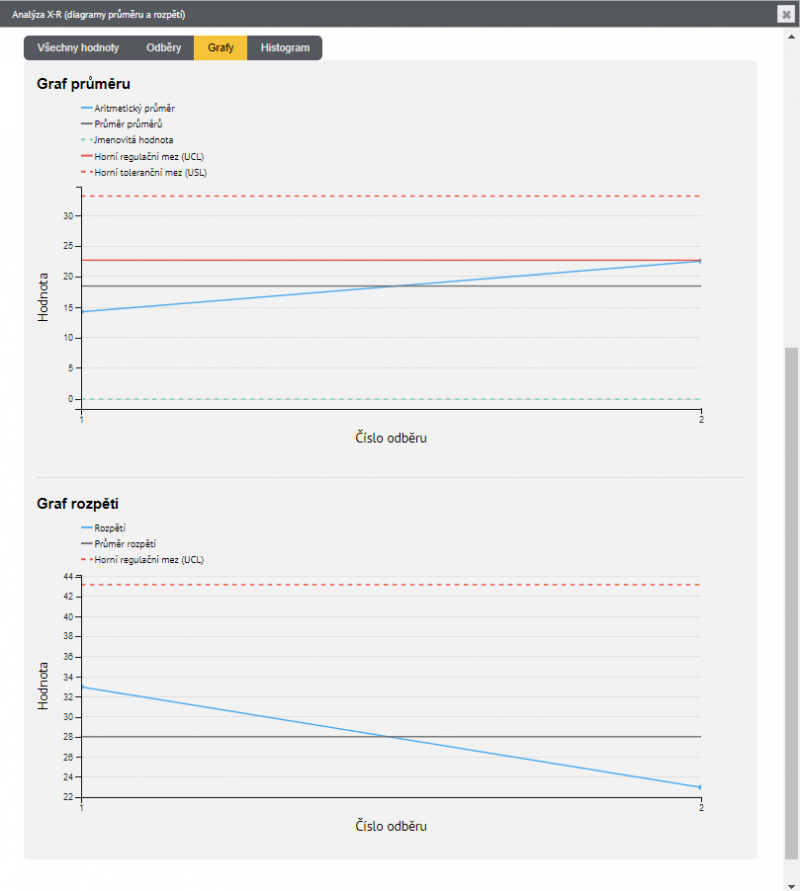
Average and range graphs (for X-R analysis)
- X-R analysis allows to display graphs of the arithmetic average and range of individual samples.
Average and standard deviation graphs (for X-s analysis)
- X-s analysis allows to display graphs of arithmetic mean and mean standard deviations of individual samples.
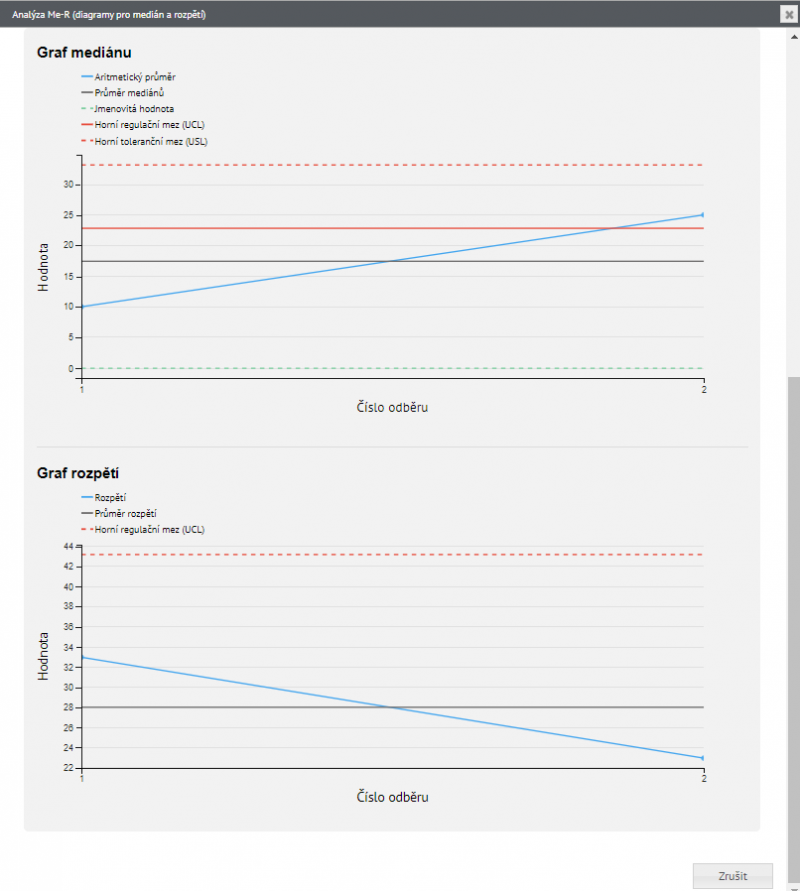
Median and range graphs (for Me-R analysis)
- Me-R analysis allows to display graphs of the median and range of individual samples.
Histogram
- In all analyzes, a histogram is given, which should ideally copy the Gaussian distribution. The Gaussian distribution is indicated by a green area, in which the numbers of measured identical values are then plotted. The histogram is plotted in the context of the tolerance limits of the characteristic.